
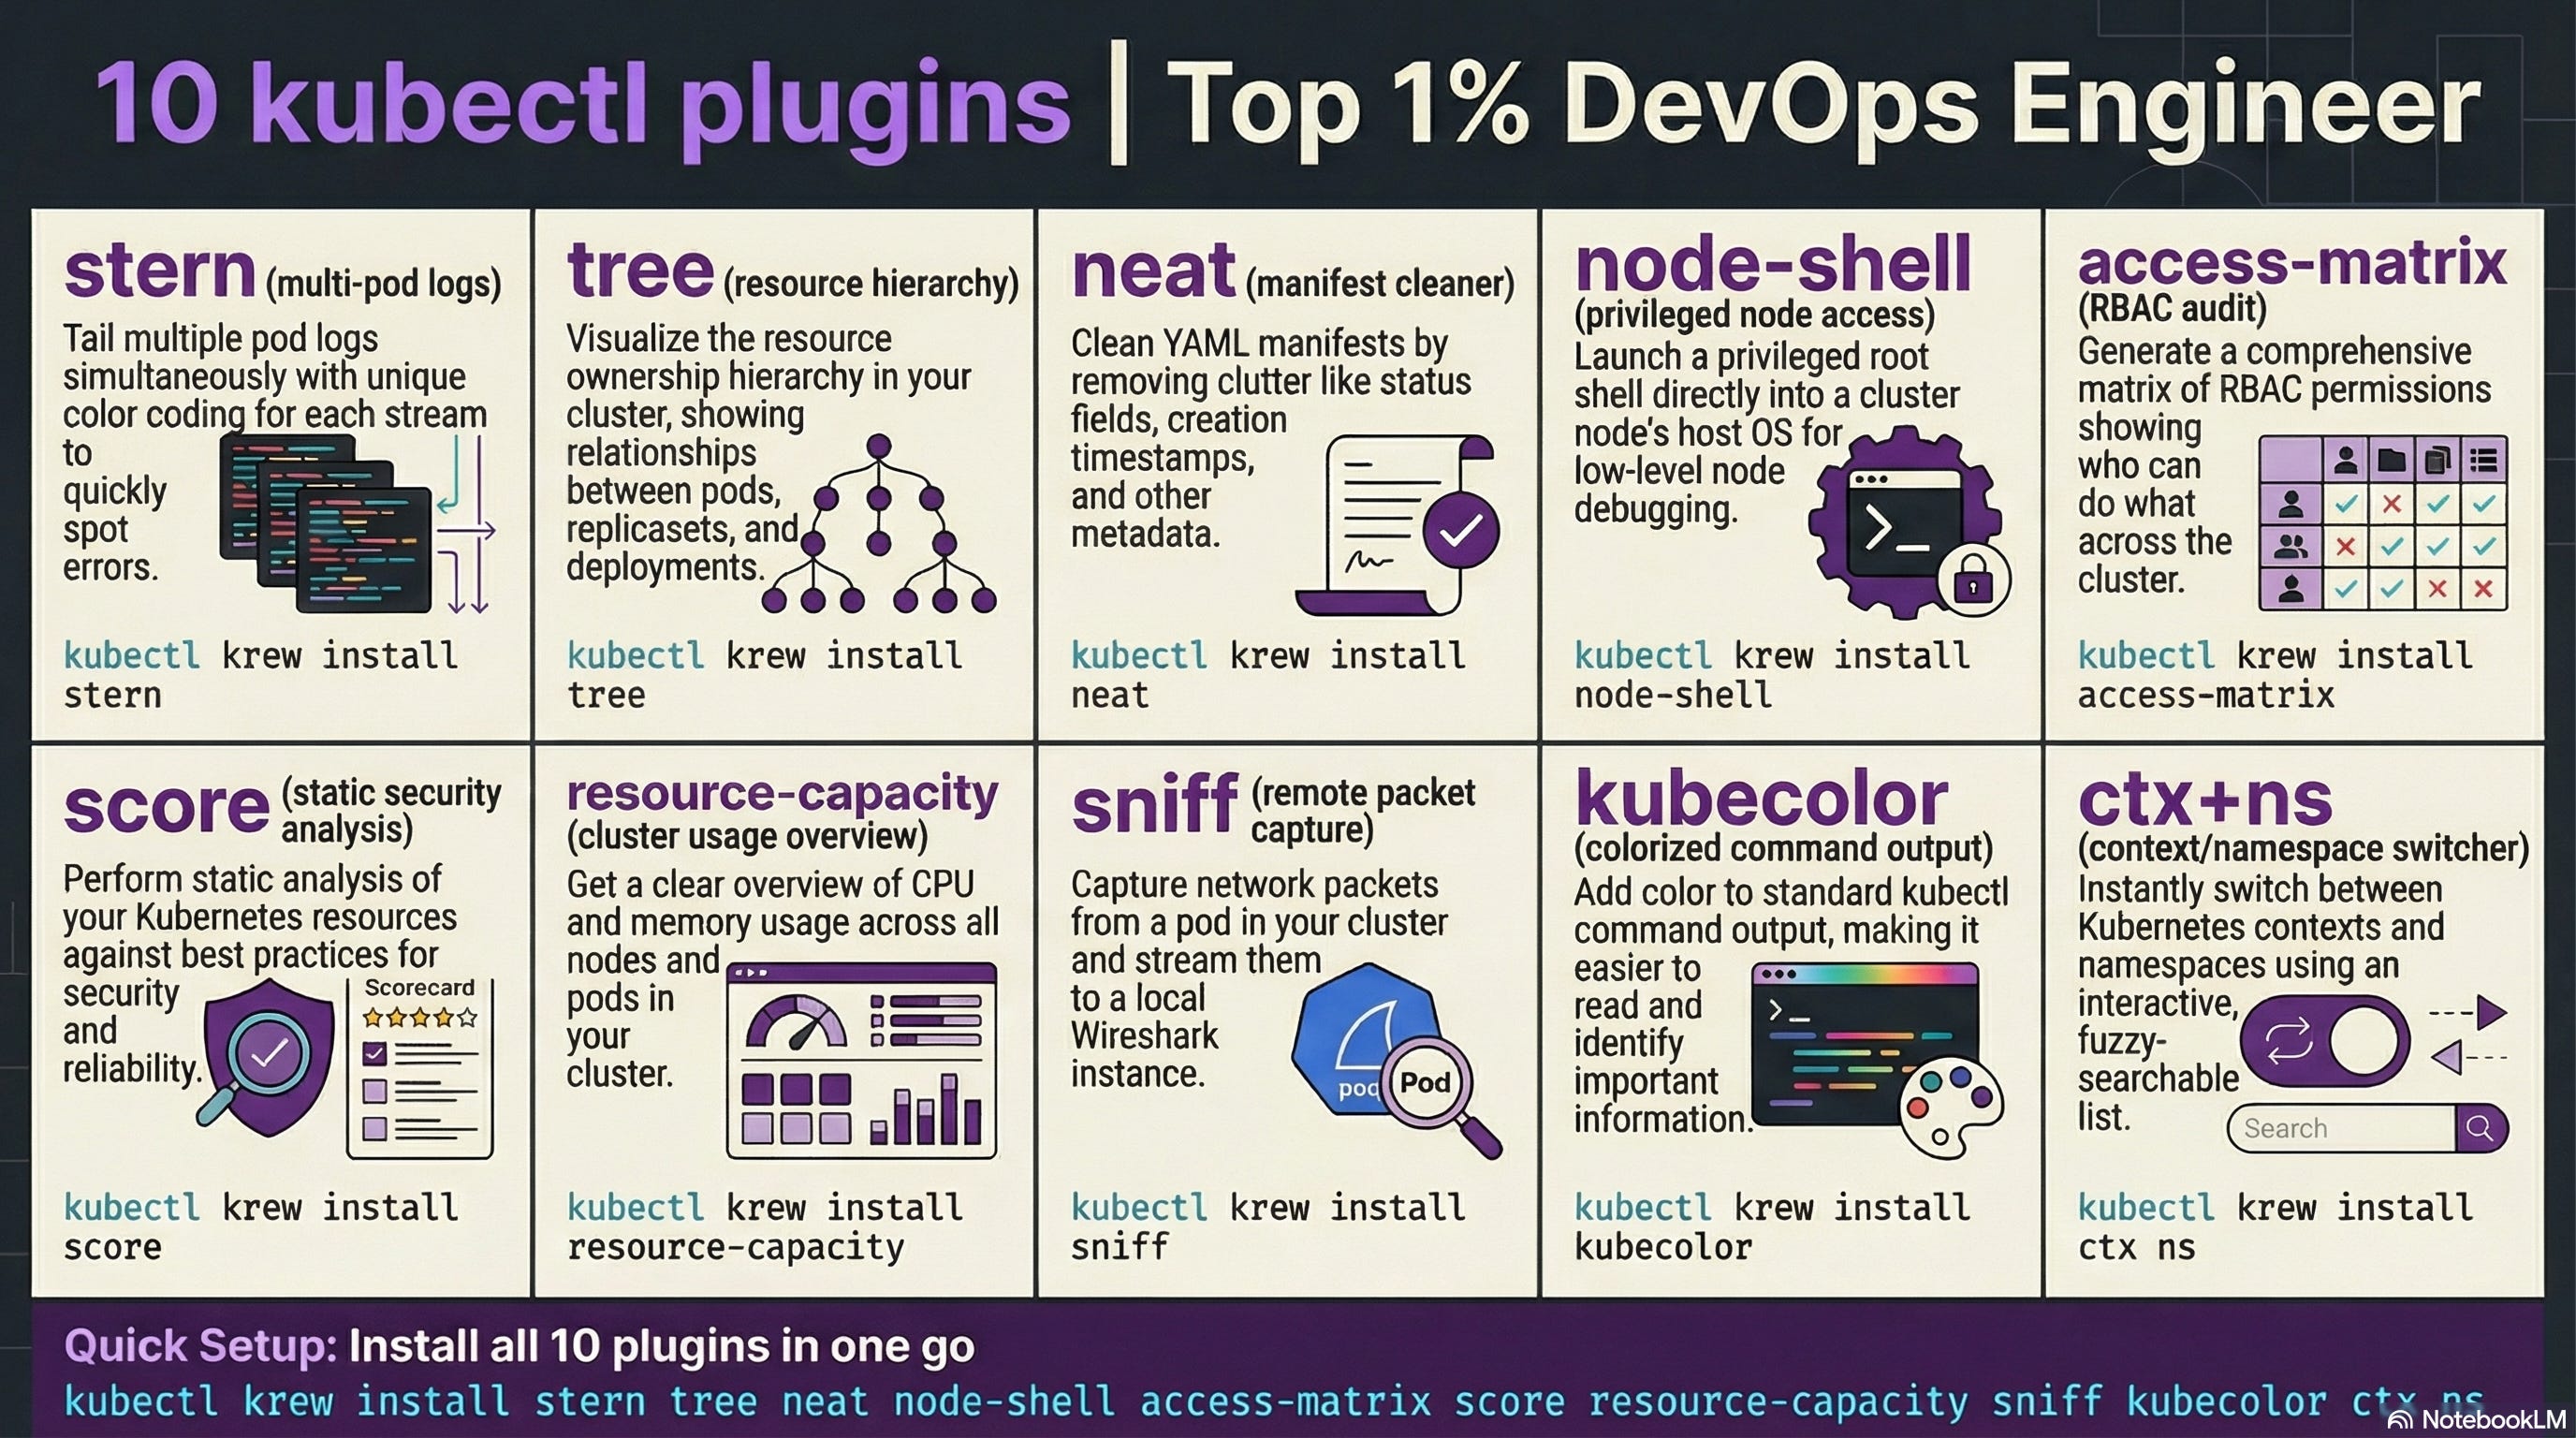
10 Kubectl Plugins That Make You a Top 1% DevOps Engineer
I watched a senior SRE debug in 5 minutes what took me 45. These were her plugins.

Last month, I watched a senior SRE debug a pod networking issue in 5 minutes flat.
The same issue took me 45 minutes the week before. Same cluster. Same access. Same version of kubectl.
I sat behind her, watching her terminal. She wasn't typing faster. She wasn't smarter about networking. She just ran commands I'd never seen before.
kubectl tree deployment/api-gateway
A full ownership hierarchy. Deployment to ReplicaSet to Pods to EndpointSlices. One command. I spent 20 minutes manually tracing that chain with get and describe.
kubectl stern api-gateway
Logs from all 12 pods, color-coded by pod name, streaming in real-time. I had been tailing one pod at a time in separate terminals.
kubectl neat get pod api-gateway-7f4d8b9c6-x2k4p -o yaml
Clean YAML. No managed fields. No status noise. Just the spec I actually needed to read.
She looked at me and said, "You're not using Krew, are you?"
I wasn't. And that conversation changed how I work with Kubernetes.
Here are the 10 kubectl plugins that closed the gap. Every single one installs through Krew in under 30 seconds.
First: Install Krew (The Plugin Manager)
Before anything else, you need Krew. It's the package manager for kubectl plugins. Think of it as brew for kubectl.
(
  set -x; cd "$(mktemp -d)" &&
  OS="$(uname | tr '[:upper:]' '[:lower:]')" &&
  ARCH="$(uname -m | sed -e 's/x86_64/amd64/' -e 's/aarch64/arm64/')" &&
  KREW="krew-${OS}_${ARCH}" &&
  curl -fsSLO "https://github.com/kubernetes-sigs/krew/releases/latest/download/${KREW}.tar.gz" &&
  tar zxvf "${KREW}.tar.gz" &&
  ./"${KREW}" install krew
)
Add ~/.krew/bin to your PATH. Then installing any plugin is just:
kubectl krew install <plugin-name>That's it. Now let's get to the plugins that matter.
1. stern — Multi-Pod Log Tailing
The problem: You have 15 replicas of a service. A user reports an error. Which pod handled that request? You don't know. So you open 15 terminal tabs and tail each one. Or you grep through a logging pipeline that's 3 minutes behind.
The fix:
kubectl krew install sternkubectl stern api-gatewayThat's it. Logs from all pods matching "api-gateway", streamed in real-time, color-coded by pod name.
Need to filter? It gets better.
kubectl stern api-gateway --since 5m -c nginxLogs from the last 5 minutes, only from the nginx container, across all pods.
kubectl stern api-gateway -o json | jq '.message'Pipe structured logs through jq for instant filtering.
Why it matters: During an incident, you don't have time to guess which pod is misbehaving. Stern shows you everything at once. That senior SRE found the failing pod in 30 seconds because the error was right there, highlighted in red, while 11 other pods streamed green.
But seeing the logs is only half the story. You also need to understand what owns what.
2. tree — Resource Ownership Hierarchy
The problem: A pod is failing. Who created it? Which ReplicaSet? Which Deployment? Is there an HPA attached? What about the Service and Endpoints?
You run kubectl get deployment, then kubectl get rs, then kubectl describe rs, then cross-reference labels. It takes 10 commands to trace a single ownership chain.
The fix:
kubectl krew install treekubectl tree deployment api-gatewayOutput:
NAMESPACE  NAME                                  READY  REASON  AGE
default    Deployment/api-gateway                 -              3d
default    ├─ReplicaSet/api-gateway-7f4d8b9c6     -              3d
default    │ ├─Pod/api-gateway-7f4d8b9c6-x2k4p    True           3d
default    │ ├─Pod/api-gateway-7f4d8b9c6-m9n1q    True           3d
default    │ └─Pod/api-gateway-7f4d8b9c6-p8r2s    True           2d
default    └─ReplicaSet/api-gateway-6c5a7e8d4     -              5d
default      └─Pod/api-gateway-6c5a7e8d4-k3j7f    False          5d
One command. The entire hierarchy. You can see the old ReplicaSet with a failed pod from a previous rollout. You can see exactly which pods belong to which revision.
Why it matters: During rollouts gone wrong, tree is the fastest way to see what's happening. Old ReplicaSet not scaling down? Stuck pod from a previous revision? It's all visible in one shot.
Now you can see the hierarchy. But those YAML outputs are still a mess.
3. neat — Clean YAML Output
The problem: You run kubectl get pod -o yaml and get 200+ lines of output. Half of it is managed fields, status metadata, and annotations injected by controllers. You just want to see the spec. The actual configuration.
The fix:
kubectl krew install neatkubectl neat get pod api-gateway-7f4d8b9c6-x2k4p -o yamlGone: managedFields, creationTimestamp, resourceVersion, selfLink, uid, status. What remains is the clean spec. The YAML you'd actually write.
Why it matters: When you're comparing what's running against what's in your Git repo, neat strips the noise. It's also perfect for extracting a running resource's config to save as a template. No more manual cleanup of 50 metadata lines.
Quick tip: Pipe it to diff for instant drift detection:
diff <(kubectl neat get deployment api-gateway -o yaml) deployment.yamlClean YAML makes debugging easier. But sometimes you need to go deeper than the pod level.
4. node-shell — SSH Into Nodes Without SSH
The problem: A node is behaving strangely. High iowait. Disk pressure. Kernel OOM kills. You need to get on the node to check dmesg, inspect /proc, or check disk usage. But SSH access is locked down. Your security team removed SSH keys from node AMIs. Jump boxes have been decommissioned.
The fix:
kubectl krew install node-shellkubectl node-shell worker-node-3You're in. Root shell on the node. It spins up a privileged pod with nsenter to enter the node's namespace. No SSH keys required. Uses your existing kubectl RBAC.
# Check what's killing pods
dmesg | grep -i oom

# Check disk pressure
df -h

# Inspect running processes
ps aux | head -20
Why it matters: In managed Kubernetes (EKS, GKE, AKS), SSH to nodes is increasingly restricted. Node-shell gives you root access through the Kubernetes API. When a node is evicting pods due to disk pressure at 3 AM, you need to see why. Not wait for a firewall change request.
Warning: This gives root access to the underlying node. Lock it down with RBAC. Only cluster-admins should have this. Don't give it to your interns.
Speaking of access control, knowing who can do what in your cluster is equally important.
5. access-matrix — RBAC Visibility at a Glance
The problem: Your security team asks, "Who can delete pods in the production namespace?" You start digging through ClusterRoles, RoleBindings, ClusterRoleBindings, ServiceAccounts. It's a spider web. RBAC in Kubernetes is powerful but nearly impossible to audit manually.
The fix:
kubectl krew install access-matrixkubectl access-matrix --namespace productionOutput: a matrix showing every resource type and which verbs (get, list, create, delete) are allowed. Color-coded. Red for dangerous permissions. Green for read-only.
Check a specific user:
kubectl access-matrix --as developer@company.com --namespace productionNow you see exactly what that developer can and can't do.
Why it matters: RBAC audits that took hours now take seconds. Before your next SOC2 audit, run this across all namespaces. You'll find ServiceAccounts with wildcard permissions that nobody remembers creating.
If you're finding this useful, subscribe to DecodeOps. I break down one real-world DevOps problem every week.
You know who has access. Now let's make sure what you're running is actually well-configured.
6. score — Kubernetes Best Practices Scoring
The problem: Your YAML works. Pods are running. But is your configuration actually good? Are you setting resource limits? Readiness probes? Pod disruption budgets? Security contexts? You don't know what you don't know.
The fix:
kubectl krew install scorekubectl score deployment api-gatewayIt scores your resource against best practices. You get a numerical score and specific recommendations:
Missing resource limits? It tells you.
No readiness probe? Flagged.
Running as root? Warning.
No pod disruption budget? Noted.
Why it matters: It's a linter for your running Kubernetes resources. Run it in CI before deploying. Run it against production to find gaps. I ran it against our staging cluster and found that 7 out of 12 deployments had no memory limits set. We were one traffic spike away from OOM-killing the entire node.
Quick tip: Pipe the output to JSON for automated scoring in your pipeline:
kubectl score deployment api-gateway -o json | jq '.score'Your configs are scored. But sometimes you need to see real-time resource consumption, not just configuration.
7. resource-capacity — Cluster Resource Overview
The problem: How much CPU and memory is your cluster actually using versus what's allocated versus what's available? kubectl top nodes gives you current usage. kubectl describe node gives you allocatable. But correlating requests, limits, and actual usage across 50 nodes? That's a spreadsheet exercise.
The fix:
kubectl krew install resource-capacitykubectl resource-capacityOutput:
NODE              CPU REQUESTS   CPU LIMITS    MEMORY REQUESTS   MEMORY LIMITS
worker-1          1850m (92%)    3200m (160%)  4.2Gi (67%)       8.1Gi (129%)
worker-2          900m (45%)     1800m (90%)   2.1Gi (33%)       4.0Gi (64%)
worker-3          1700m (85%)    2900m (145%)  3.8Gi (61%)       7.2Gi (115%)
Requests, limits, and percentages. Per node. One command.
Add --pods to see which pods are consuming what on each node:
kubectl resource-capacity --pods --sort cpu.requestsWhy it matters: Overcommitted nodes crash. Undercommitted nodes waste money. This plugin shows you both in one glance. That worker-1 node at 160% CPU limits? It's overcommitted. If all pods spike simultaneously, the kernel will throttle or kill them.
Now you can see resource allocation. But what about the network traffic between those pods?
8. sniff — Packet Capture on Pods
The problem: A service isn't responding correctly. The logs look fine. The app says it sent the response. But the client says it never received it. Is it a network policy? A service mesh sidecar? A DNS issue? You need to see the actual packets.
The fix:
kubectl krew install sniffkubectl sniff api-gateway-7f4d8b9c6-x2k4p -f "port 8080"It starts a tcpdump on the pod and streams the output to your local Wireshark. Yes, Wireshark. On your laptop. Capturing packets from a pod running in your cluster.
No need to install tcpdump in your container image. No need to exec into the pod. It handles everything by deploying a sidecar.
Why it matters: Network debugging in Kubernetes is painful without packet captures. Service mesh mTLS stripping headers? Network policy silently dropping traffic? DNS returning stale records? Sniff shows you the actual bytes on the wire. When the senior SRE I mentioned used this during a service mesh migration, she found that Istio was stripping a custom header the upstream service required. No amount of log reading would have caught that.
Warning: Don't run this in production during peak traffic. Packet capture adds overhead. Use it during maintenance windows or on staging replicas.
Packet captures are powerful for debugging. But wouldn't it be nice if your terminal just made kubectl output prettier by default?
9. kubecolor (Standalone tool)
The problem: kubectl output is monochrome. A wall of white text. Pod statuses, resource types, timestamps all blur together. When you're scanning 50 pods for the one that's CrashLoopBackOff, your eyes do all the work.
The fix:
This one isn't a Krew plugin. It's a standalone wrapper:
# macOS
brew install kubecolor/tap/kubecolor

# Linux
go install github.com/kubecolor/kubecolor@latest
Then alias it:
alias kubectl="kubecolor"Now every kubectl command has colored output. Pod status Running is green. CrashLoopBackOff is red. Pending is yellow. Resource types are highlighted. Namespaces are color-coded.
Why it matters: It sounds trivial. It's not. When you're scanning output during an incident, color is information. Your brain processes "red text" faster than reading the word "Error." After a week with kubecolor, going back to plain kubectl feels like reading a book with no punctuation.
Quick tip: It respects all kubectl flags and plugins. Everything works the same, just colored.
Your terminal is colorful now. But there's one more plugin that ties the whole workflow together.
10. ctx + ns — Context and Namespace Switching
The problem: You manage 5 clusters. Dev, staging, production-us, production-eu, and a sandbox. Switching between them means typing kubectl config use-context gke_myproject_us-central1_prod-cluster. Switching namespaces means kubectl config set-context --current --namespace=monitoring. Every. Single. Time.
The fix:
kubectl krew install ctx
kubectl krew install ns
kubectl ctxInteractive list of all contexts. Select one. Done.
kubectl nsInteractive list of all namespaces. Select one. Done.
kubectl ctx prod-us
kubectl ns monitoring
Direct switch. No interactive menu. Two words.
Why it matters: If you switch contexts 20 times a day, each switch saves you 5-10 seconds of typing. That's 2-3 minutes daily. But the real value is accuracy. Typing long context names is error-prone. Running a command against production when you thought you were on staging is the kind of mistake that ruins a weekend. ctx and ns make that nearly impossible.
When NOT to Use Plugins
Here's the thing. Not every plugin belongs in your workflow.
Don't install 50 plugins. Each one adds PATH weight and cognitive load. These 10 cover 90% of use cases. If you find yourself reaching for more, you probably need a platform tool like Lens or k9s instead.
Don't use node-shell without RBAC lockdown. It gives root on the host. In the wrong hands, it's a security incident waiting to happen.
Don't use sniff in production during peak hours. Packet capture adds overhead. It can impact latency for real users.
Don't rely on plugins for automation. Plugins are for human operators. Your CI/CD pipelines should use explicit kubectl commands with deterministic flags. Don't put kubectl neat in a pipeline. Put it in your fingers.
Don't skip the docs. Each plugin has edge cases. Stern's regex matching. Tree's CRD support. Score's opinionated defaults. Read the README before you trust the output.
The Full Install Script
Here's everything in one shot:
# Install Krew first (see above), then:
kubectl krew install stern
kubectl krew install tree
kubectl krew install neat
kubectl krew install node-shell
kubectl krew install access-matrix
kubectl krew install score
kubectl krew install resource-capacity
kubectl krew install sniff
kubectl krew install ctx
kubectl krew install ns

# kubecolor is separate
brew install kubecolor/tap/kubecolor

# Add to your .zshrc or .bashrc
alias kubectl="kubecolor"
Takes about 2 minutes. Changes how you work forever.
That's it for this week. Go install these plugins. Your future self during the next incident will thank you.
That senior SRE didn't have superpowers. She just had better tools loaded into her terminal. Now you do too.
Which kubectl plugin saved you the most debugging time? Drop it in the comments. I'm always looking for new ones.
See you next week. Try not to break production before then.
Keep decoding, Bhanu from DecodeOps