

Kubernetes probes explained — practical guide for DevOps
I break down the 3-probe strategy (Liveness, Readiness, Startup) with a full deep dive that includes code, diagrams, and debugging tips.

Your Kubernetes pod says "Running," but your app is dead. Sound familiar?
You check your dashboard. All green. "kubectl get pods" shows everything is "Running".
But your users are getting timeouts. Your service is down.
You're dealing with zombie pods: containers that are technically running but are completely unresponsive, deadlocked, or failing internally. They are the silent killers of service availability, and they make a mockery of your "highly available" architecture.
This isn't just frustrating; it's a critical failure of automated deployment.
Here’s your 3-probe strategy for robust applications.
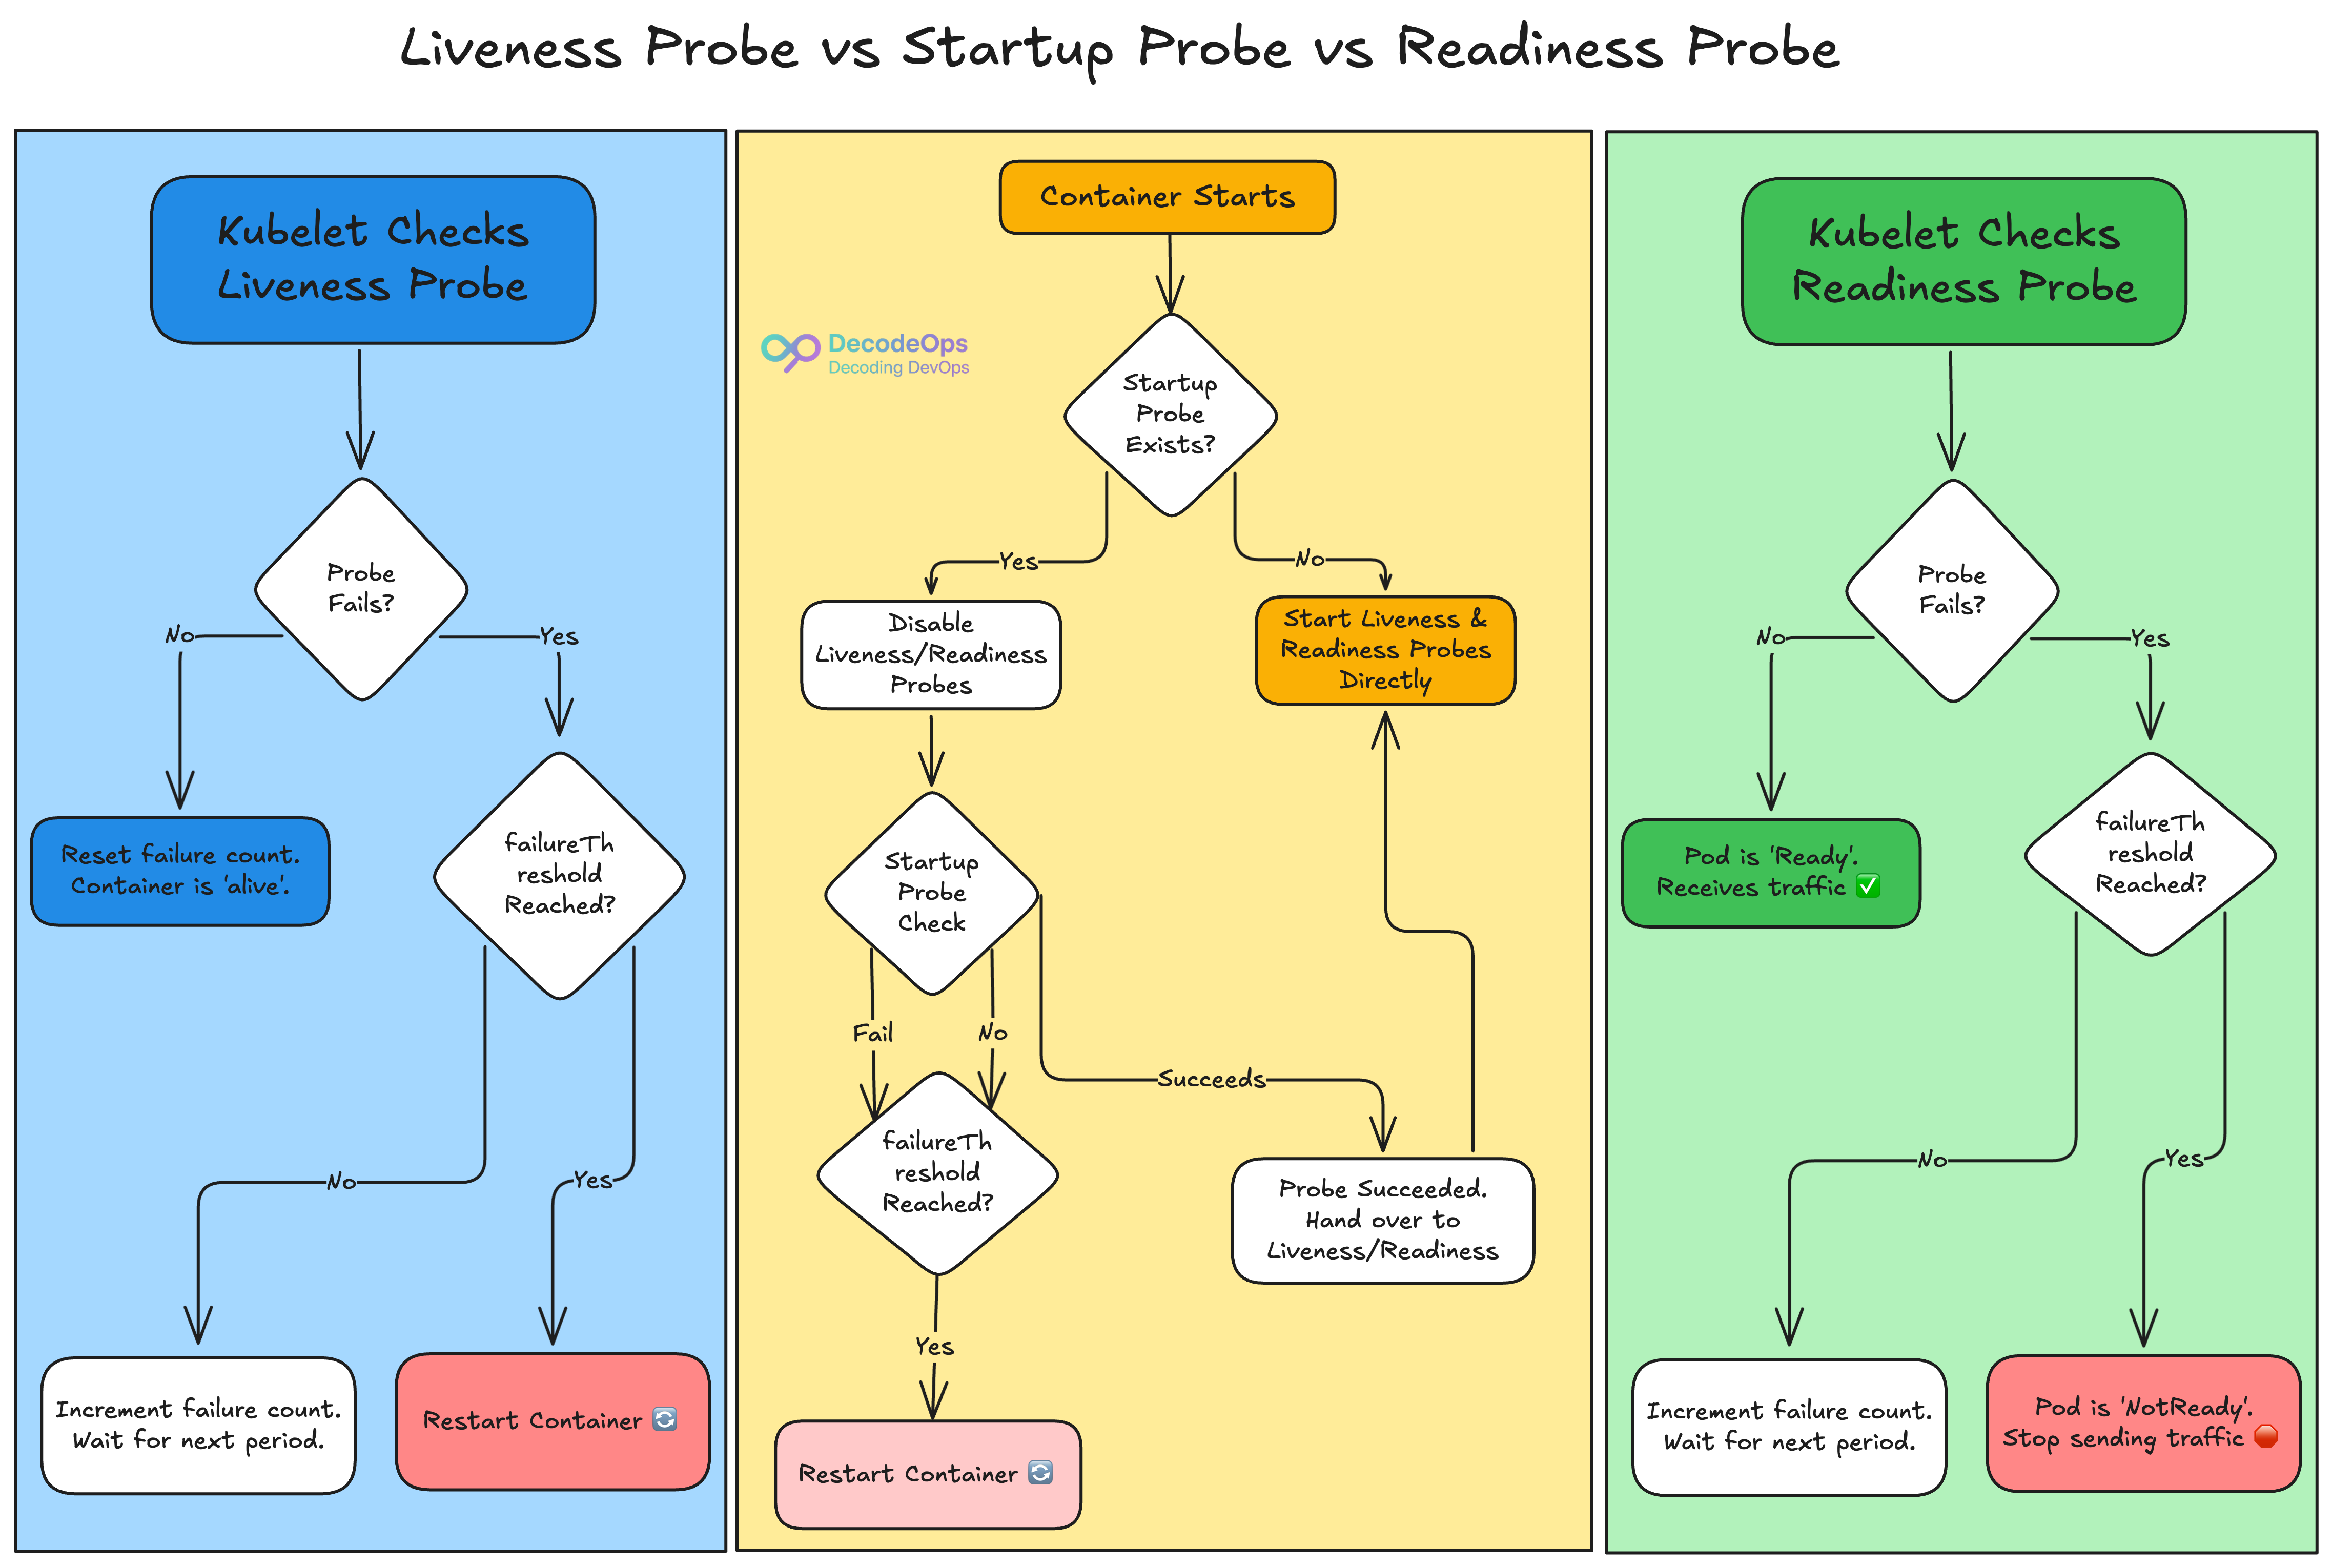
1. The Liveness Probe:
This is your deadlock detector.
A liveness probe answers one question: "Is this container still functioning?"
If this probe fails, Kubernetes knows the application is internally broken (even if the process is running) and will restart the container. It functions as an automatic kill switch for zombie pods.
Use Case: An application becomes trapped in an infinite loop but does not crash.
For instance,
livenessProbe:
  httpGet:
    path: /healthz
    port: 8080
  initialDelaySeconds: 15
  periodSeconds: 20
  failureThreshold: 3
What this does:
Waits for 15 seconds after the container starts.
Every 20 seconds, it makes an HTTP GET request to the "/healthz" endpoint.
If the probe fails three times in a row, the container will be restarted.
2. The Readiness Probe:
This is the traffic police.
A readiness probe responds to the question: "Is this container ready to accept new connections?"
If this probe fails, Kubernetes keeps the container running but deletes it from the service endpoint. No new traffic will be transmitted until the probe passes again.
Use Case: An application that needs to warm up caches, load data, or connect to a database during launch.
For instance,
readinessProbe:
  httpGet:
    path: /ready
    port: 8080
  initialDelaySeconds: 5
  periodSeconds: 10
What this does:
Stops traffic from being routed to the pod until the /ready endpoint returns a 200 OK.
Only completely initialised pods are added to the load balancer, which prevents unsuccessful requests during deployments.
3. The Startup Probe:
This is your patience mechanism.
A startup probe responds to the straightforward query, "Has the application started yet?"
It is especially made for programs that take a long time to start up (think of old Java apps or services that require a lot of initial calculations). In order to keep the Kubelet from killing a container that is simply taking a long time to boot, it turns off the liveness and readiness probes until it is successful.
Use Case: A complicated microservice that may take a few minutes to start up.
For instance,
startupProbe:
  httpGet:
    path: /healthz
    port: 8080
  failureThreshold: 30
  periodSeconds: 10
What this does:
Gives the container 300 seconds (30 failures * 10 seconds) to restart successfully.
Only after this probe succeeds will the liveness and readiness probes take over.
This single-handedly solves most CrashLoopBackOff issues for slow containers.
How Probes Work: Four Mechanisms
Kubernetes provides four mechanisms for performing these health checks:
HTTP GET: The Kubelet sends an HTTP GET request to the container's defined port and path. A response with an HTTP status code of 200 to 399 is deemed successful. This is a popular option for web apps and APIs.
TCP Socket: The Kubelet attempts to establish a TCP connection to a certain port on the container. If the link is established, the probe is considered successful. This is appropriate for apps that do not have an HTTP endpoint but listen to a specific TCP port.
Exec Command: The Kubelet executes the provided command within the container. An exit code of 0 indicates a success. This allows for a high degree of freedom when running customised health checks.
gRPC: For gRPC-enabled applications, this probe uses the standard gRPC health checking protocol to determine the service's state.
Configuring Probes: Key Parameters
When defining a probe in a Pod's specification, you can fine-tune its behaviour using a few essential parameters:
intialDelaySeconds: The number of seconds to wait after the container starts before the first probe is launched.
periodSeconds: The frequency at which the probe is used.
timeoutSeconds: The number of seconds after which the probe times out.
successThreshold: The minimum consecutive successes for the probe to be considered successful after having failed.
failureThreshold: The quantity of successive failures that indicates that the probe has failed.
Debugging probe problems — a brief checklist
If pods keep restarting or aren’t receiving traffic:
kubectl describe pod <pod> — look at Events; probe failures are logged.
kubectl logs <pod> — inspect app logs for slow initialization or errors.
kubectl exec -it <pod> -- curl -sv http://localhost:8080/healthz — reproduce the probe locally inside the container.
Check initialDelaySeconds, timeoutSeconds, and failureThreshold — short timeouts are the most common culprit.
Validate application endpoints: /healthz vs /ready must return 200 for httpGet.
Practical tuning tips
Increase initialDelaySeconds and timeoutSeconds for workloads that are native-image or heavily reliant on the JVM. It frequently takes longer for these programs to warm up.
Use readinessProbe to prevent traffic during warm-up (DB migrations, caches).
Prefer httpGet for web apps (clear status codes) and exec for internal binary checks that validate dependencies.
Set failureThreshold and periodSeconds to avoid flapping during transient network blips.
Add observability: emit a metric like probe_failure_total{type="liveness"} to your monitoring stack. Alert on rising trends, not single failures.
Stop Guessing, Start Probing
Relying on the Running state is a gamble, not a plan.
By utilising a basic but effective probing method, you can go from a reactive to a proactive state. You create a system that does more than just run; it recognises when it is healthy. It automatically fixes itself, safeguards the user experience during rollouts, and allows you to sleep better at night.
Stop fighting the zombie pods. Start developing really resilient applications.
What's the most common application failure that a Kubernetes probe has saved you from? Share your war story in the comments below!