

The Kubernetes Anti-Patterns
You Will Learn These After Your First Major Outage

Picture this.
It’s 2 AM. Your cluster is melting down.
Pods are restarting in waves. Nodes are flapping. Your monitoring dashboard is red.
You did everything right. You read the docs. You followed best practices. Your YAML passed every linter.
But production doesn’t care about your staging environment.
Here’s what nobody tells you: Kubernetes gives you enough rope to hang yourself. The platform assumes you understand distributed systems, resource contention, and failure modes. It assumes you’ve been burned before.
Most of us haven’t.
So we make the same mistakes. We set configurations that sound safe. We follow patterns that look reasonable. Then production traffic hits, or a node dies, or a deployment goes sideways, and we discover what we built.
This article covers 5 Anti-Patterns that look fine until they don’t.
These aren’t beginner mistakes. These are decisions that seem correct, that pass code review, that work for months, until the conditions align and your pager goes off.
Let’s start with the quiet killer.
1. Setting Requests = Limits
You set your resource requests equal to your limits.
resources:
  requests:
    memory: "512Mi"
    cpu: "500m"
  limits:
    memory: "512Mi"
    cpu: "500m"
Why it seemed smart:
This is called a “Guaranteed” QoS class in Kubernetes. The docs make it sound premium. Your pod gets priority during scheduling. It’s protected during resource pressure.
Protected. That’s the word that gets you.
Why this is an anti-pattern:
Memory: Apps have spikes (cache warming, batch jobs). If your app tries to allocate 520MB, the OOMKiller shoots it instantly. No graceful shutdown. Just death.
CPU: CPU is a compressible resource. By setting a limit, you are opting into CPU Throttling. Even if the host node has idle CPU available, Kubernetes will throttle your app to exactly 500m, causing massive latency spikes during startup or traffic surges.
What to do instead:
Set requests based on your baseline usage. Set limits higher, or don’t set CPU limits at all.
resources:
  requests:
    memory: "512Mi"
    cpu: "500m"
  limits:
    memory: "1Gi"
    # No CPU limit
This gives your app room to breathe. It can handle spikes without dying. And Kubernetes can still make smart scheduling decisions based on your requests.
2. Aggressive Liveness Probes
You set your liveness probe to catch failures fast.
livenessProbe:
  httpGet:
    path: /health
    port: 8080
  initialDelaySeconds: 10
  periodSeconds: 5
  timeoutSeconds: 2
  failureThreshold: 2
Why it seemed smart:
Fast detection means fast recovery. If the app hangs, you want it restarted immediately.
Why this is an anti-pattern:
Your app gets slow during a traffic spike. Response times jump from 100ms to 3 seconds.
Your liveness probe times out after 2 seconds.
Kubernetes kills the pod. The pod restarts. It needs 10 seconds to initialize. During those 10 seconds, the remaining pods handle even more traffic. They get slower. Their probes start timing out.
Kubernetes kills them too.
Now you’re in a restart cascade. Every pod is flapping between starting and dying. Your entire deployment is unstable, not because the app is broken, but because your probes are too aggressive for normal production variance.
Worse, if your startup is slow (loading caches, warming JIT, connecting to databases), your initialDelaySeconds might be too short. The pod gets killed before it finishes starting. It restarts. Gets killed again. You’re stuck in a boot loop.
The liveness probe isn’t protecting you. It’s amplifying transient slowness into total failure.
What to do instead:
Use liveness probes to detect deadlock, not slowness.
Set conservative timeouts. Give your app room for normal variance.
livenessProbe:
  httpGet:
    path: /health
    port: 8080
  initialDelaySeconds: 30
  periodSeconds: 10
  timeoutSeconds: 5
  failureThreshold: 3
Note: Use Readiness Probes to handle traffic routing during slowness.
3. No PodDisruptionBudgets
You deploy your application. Three replicas. High availability. You’re covered.
Then your cluster does a routine node upgrade.
All three pods get evicted at once. Your service goes down. During maintenance.
You never set a PodDisruptionBudget.
Why it seemed smart:
You have replicas. Kubernetes is supposed to handle this. If a node goes down, the other pods keep running. That’s the whole point of distributed systems.
PodDisruptionBudgets feel like extra config. You’ll add them later. After you ship. When things are stable.
Besides, your pods restart fast. A brief blip during maintenance is fine. Users can retry.
Why this is an anti-pattern:
Kubernetes has two types of disruptions: involuntary and voluntary.
Involuntary disruptions are the ones you plan for. Node crashes. Hardware failures. Kernel panics. Your replicas protect you here.
Voluntary disruptions are controlled. Node drains. Cluster upgrades. Autoscaler scale-downs. Kubernetes asks your pods to leave.
Without a PodDisruptionBudget, Kubernetes assumes it can evict all your pods at once. It’s being efficient. Why drain nodes one at a time when it can drain three?
Your three-replica deployment becomes zero replicas. Not because of a failure. Because of maintenance.
The worst part? This happens during low-traffic hours. When you’re asleep. Your monitoring misses it because the outage is short. But your users see it. And they remember.
What to do instead:
Define how many pods must stay running during voluntary disruptions.
apiVersion: policy/v1
kind: PodDisruptionBudget
metadata:
  name: my-app-pdb
spec:
  minAvailable: 2
  selector:
    matchLabels:
      app: my-app
Now, Kubernetes is forced to drain nodes one at a time, ensuring 2 pods are always up.
4. Hardcoding Dependencies
You configure your app to talk to other services.
env:
  - name: DATABASE_URL
    value: "postgres://db.production.svc.cluster.local:5432"
Why it seemed smart:
You’re being explicit. No magic. No guessing. Your app knows exactly where to find its dependencies.
The full DNS names are clear. db.production.svc.cluster.local tells you it’s in the production namespace, it’s a service, it’s in the cluster. Good documentation through naming.
Why this is an anti-pattern:
Your dependencies aren’t static. They evolve.
You decide to split your monolithic database. Now you need users-db and orders-db. Every service that hardcoded the database URL needs to be updated and redeployed.
You want to test a new Redis version in a separate namespace. Can’t do it without changing your app config.
Your API service needs to do a blue-green deployment with a temporary service name. Your consumers are pointing at the wrong name.
Worse, DNS resolution can fail. Temporarily. When DNS is slow or unavailable, your app crashes on startup because it can’t resolve the hardcoded hostname. It never gets far enough to retry or fall back.
The coupling is tight. Every change to your infrastructure requires coordinated updates across multiple deployments. Your velocity drops. Your deployments become scary.
What to do instead:
Use Kubernetes services for abstraction. Let DNS be dynamic.
env:
  - name: DATABASE_URL
    value: "postgres://db:5432" # Relies on namespace scope
Pro Tip: Use a Service Mesh or ConfigMaps for cross-namespace routing. Don’t bake topology into your images.
5. The Rolling Update That Isn't Rolling
You set your deployment strategy to RollingUpdate.
strategy:
  type: RollingUpdate
  rollingUpdate:
    maxUnavailable: 1
    maxSurge: 1
Why it seemed smart:
RollingUpdate is the default strategy. The name promises exactly what you want. Updates that roll out gradually. No big bang. No downtime.
You even tuned the parameters. maxUnavailable: 1 means only one pod goes down at a time. maxSurge: 1 means you briefly have extra capacity. It’s conservative.
Kubernetes handles the orchestration. Old pods out, new pods in. Seamless.
Why this is an anti-pattern:
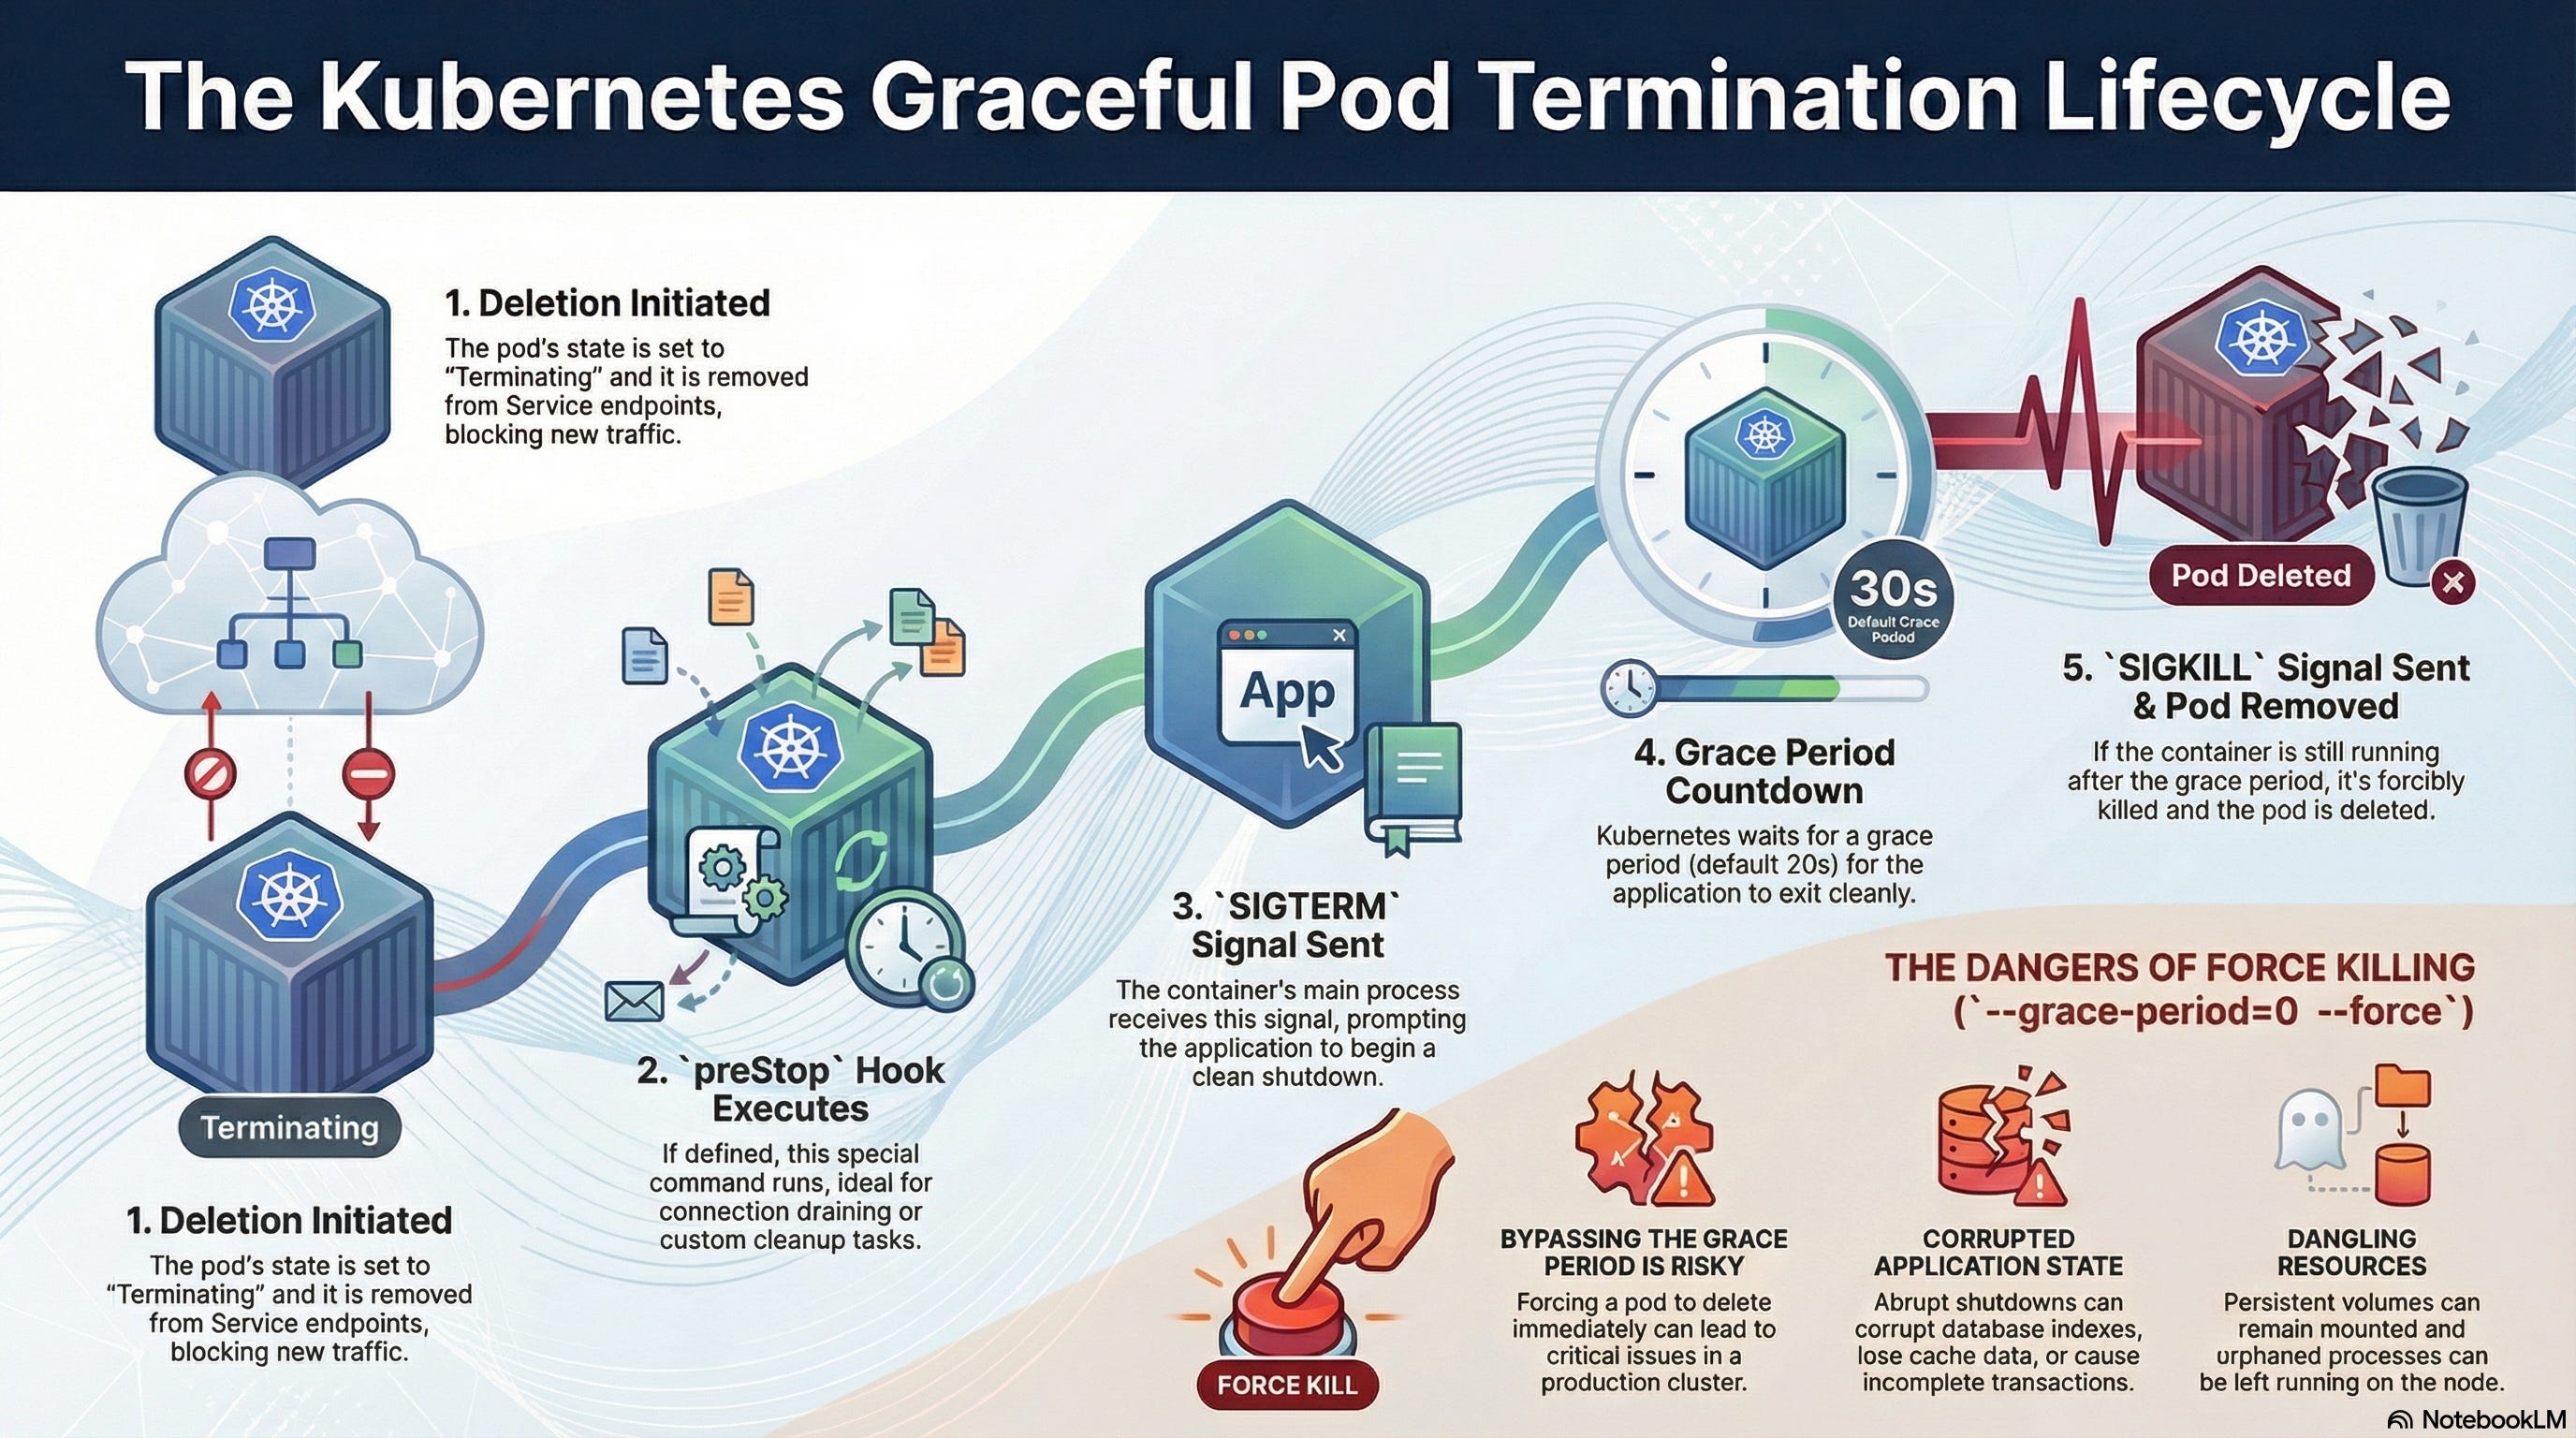
Kubernetes is a scheduler, not a load balancer. When a pod is terminated:
Kubernetes sends
SIGTERM.It removes the pod from the Endpoint list. The Race Condition: It takes time for the removal to propagate to
iptablesor the Cloud Load Balancer. During that gap, traffic is still sent to the dying pod, which is rejecting connections. Users see 502 errors.
What to do instead:
Use a preStop hook to delay the shutdown.
lifecycle:
  preStop:
    exec:
      command: ["/bin/sh", "-c", "sleep 15"]
This forces the pod to wait 15 seconds (still serving traffic) while the Load Balancer updates its list. Only then does it shut down. True Zero Downtime.
Summary
Requests ≠ Limits: Let your CPU burst.
Loose Liveness: Don’t kill slow pods; reroute them.
Use PDBs: Protect against maintenance windows.
Abstract Dependencies: Don’t hardcode FQDNs.
Use
preStopHooks: Give Load Balancers time to update.
That’s it. Five anti-patterns that looked fine until production disagreed.
You’ll make these mistakes. Everyone does. The difference is knowing what to look for when your cluster starts acting weird at 2 AM.
A Quick Milestone: We just hit 100 subscribers on Substack! That’s wild. Thank you for reading, sharing, and dealing with my production therapy sessions every week.
If this post saved you from an outage (or explained one you already had), hit reply. I read everyone.
Not subscribed yet? Fix that.
Don’t let your cluster stay dumb.
Fix these so that you can sleep well

“ Requests ≠ Limits: Let your CPU burst.
Loose Liveness: Don’t kill slow pods; reroute them.
Use PDBs: Protect against maintenance windows.
Abstract Dependencies: Don’t hardcode FQDNs.
Use preStop Hooks: Give Load Balancers time to update.”
great final list here! some key learnings distilled. great read ty